


2019-09-17
The US tops 37.9 GW of large scale solar
That record figure of utility scale PV was under contract at the end of June with 8.7 GWdc under construction. However, installation levels fell slightly, year-over-year.
September 17, 2019 Christian Roselund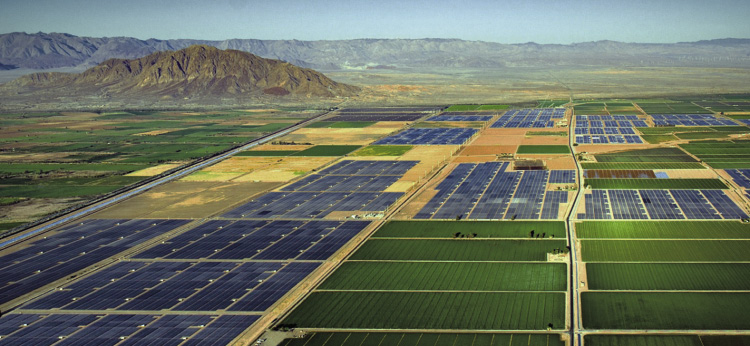
Large scale solar is roaring along in the U.S. as developers aim to break ground this year to claim higher tax benefits.
Image: 8minute Solar Energy
From pv magazine USA.
We’ve been expecting this for some time. At the beginning of the year, pv magazine reported an unprecedented volume of solar projects in the interconnection queues of six grid operators, totaling 139 GWac. We’d missed one (the Southwest Power Pool), which would have brought the total to 154 GWac.
Now it appears those projects and others in the south and mountain west – areas which do not have independent grid operators – are beginning to move forward with power contracts and even steel in the ground.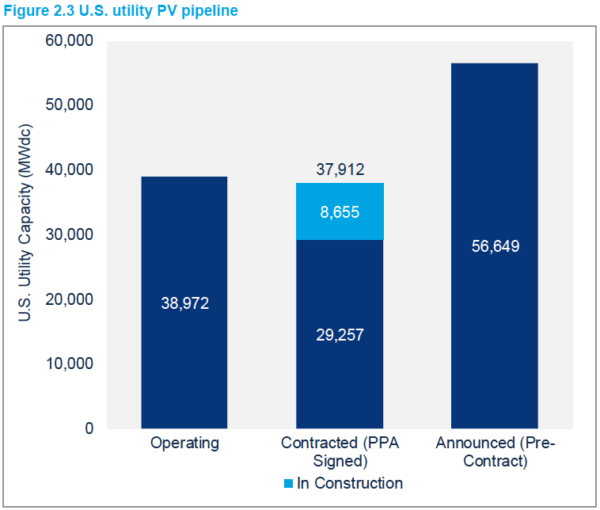
According to the latest U.S. Solar Market Insight report by analyst Wood Mackenzie and the Solar Energy Industries Association, at the end of the second quarter the volume of large scale solar projects under contract across the United States had ballooned to 37.9 GWdc, with 8.7 GWdc of those under construction. That is in part the result of 11.2 GWdc of new projects that won contracts in the first half of the year.
Those numbers are supported by data from the U.S. Department of Energy’s Energy Information Administration (EIA). The EIA reported 1.4 GW of PV module shipments in June and 1.1 GW in July – the highest monthly volumes seen since November, when developers were frantically importing to avoid the pending Section 201 tariffs.
A slow Q2
Second quarter installation figures were unimpressive, however. The United States only installed 2.1 GWdc of solar during the period, for a 7% year-over-year contraction.
A sectoral breakdown showed the figures were highly uneven. The non-residential sector – where Wood Mackenzie lumps together commercial and industrial, non-profit, government and even community solar arrays – is set to fall for the second straight year. Only 426 MWdc was installed during the second quarter, less than the amount added from January to March. Wood Mackenzie blamed policy changes in California, Massachusetts and Minnesota.
However the utility scale sector was relatively strong with more than 1 GW installed in the second quarter. Residential solar installations too, continued to recover after the crash of 2016 and 2017. Household volumes were up a cheerful 8% year-over-year despite continued contraction at Tesla/SolarCity, which at its height was responsible for a third of the market.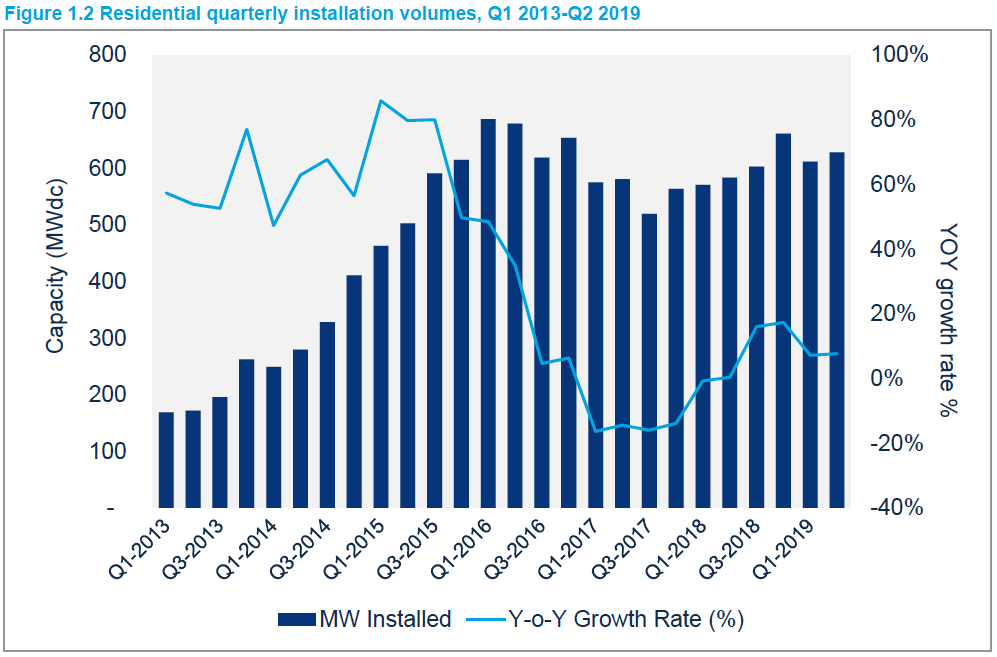
Geographically, there were no big surprises. California led again with Florida second – by a wide margin – and North Carolina third. Later in the year, however, we can expect higher installation volumes in Florida and perhaps Texas, where project development is booming.
Looking ahead
Several of the projects making up that wave of utility scale solar are not expected to be completed this year. Although the federal Investment Tax Credit (ITC) falls from 30% to 26% next year, if contractors begin construction this year they can claim the full 30%. Wood Mackenzie is forecasting 12.6 GWdc of solar will be installed this year and has reduced its utility scale forecast due to completion of many projects being pushed out to next year or later.
However, the analyst has raised its 2020 and 2021 forecasts, with 17.6 GW expected in 2021 after almost the same volume next year, as projects come online for the final hurrah of the 30% ITC.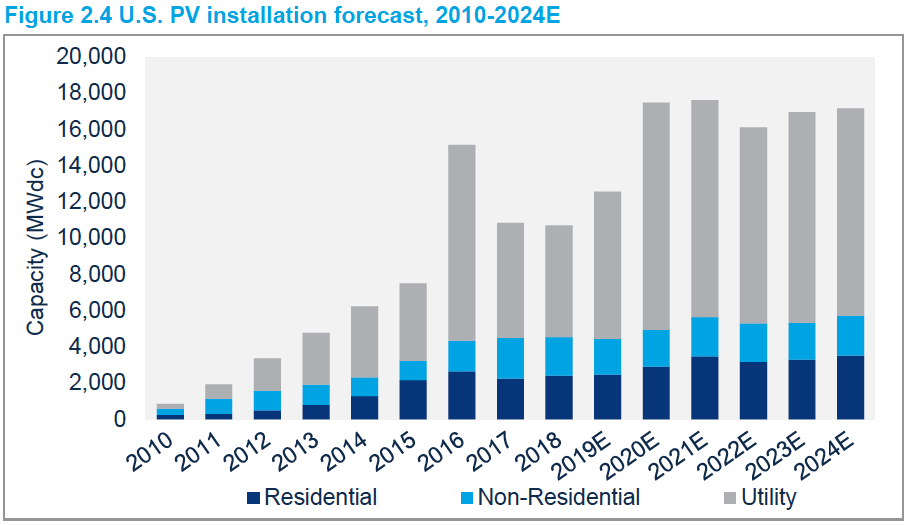
Wood Mackenzie is expecting a slight dip again in 2022 but the further out projections get, the more uncertain they become. And if one thing is true of the forecasts made by market analysts, it is that they tend to go up over time more than they go down.