


2021-11-21
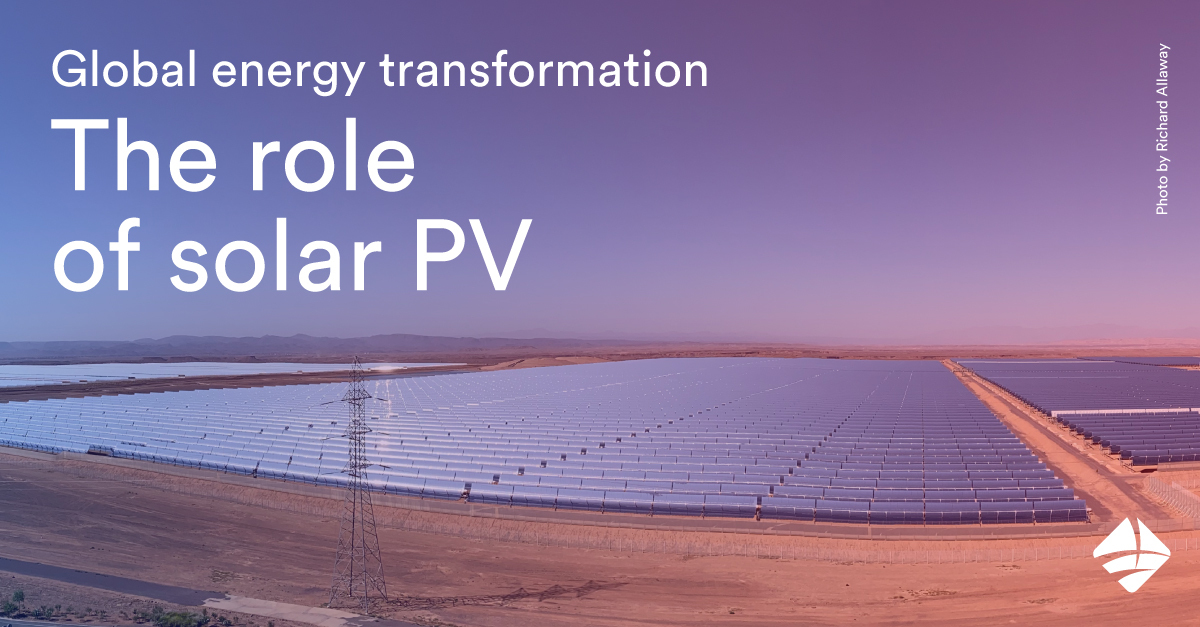
Global Energy Transformation – The role of Solar PV
Despite the impacts of the COVID-19 pandemic, renewable energy set a record in new power capacity in 2020 and was the only source of electricity generation to register a net increase in total capacity. Investment in renewable power capacity rose, although slightly, for the third consecutive year, and corporations continued to break records for sourcing renewable electricity.
Rising concerns about climate change, the health effects of air pollution, energy security, and energy access, along with volatile oil prices in recent decades, have led to the need to produce and use alternative, low-carbon technology options such as renewables. Solar PV has been one of the pioneering renewable technologies over the decades.
The total installed capacity of solar PV reached 480 GW globally (excluding CSP) by the end of 2018, representing the second-largest renewable electricity source after wind. Last year, solar PV again dominated total renewable and power capacity additions, adding twice as much capacity as wind and more than all fossil fuels and nuclear together, solar PV additions reaching around 94 GW
Global Energy Transformation – Global Market Overview
The global solar market in 2021 was dominated by Asia, accounting for over half of the world’s addition of solar capacity. The region’s installed solar capacity reached 280 GW by the end of 2021, dominated by China with 175 GW.
The European Union represented the world’s second-largest solar PV market, mainly driven by Germany with 45 GW cumulative installed capacity by the end of 2021, followed by North America with 55 GW, of which the United States accounted for 90%.
Within Asia significant deployment would be seen in China, where installed capacity is projected to reach around 1 412 GW by 2030.
China added nearly 117 GW of renewable power, bringing online more capacity in 2020 than the entire world did in 2013.
North America would have the second-highest installed solar PV capacity, reaching 437 GW by 2030, with more than 90% of these installations in the United States. Europe would represent the third-highest region by 2030, with 291 GW of solar PV capacity installed. A similar picture is expected on a 2050 horizon, when Asia would still dominate the scene at almost half of the cumulative global capacity installed (4 837 GW).
Within Asia, China would dominate the scene, with a CAGR of 9% after 2018 leading to projected capacity of around 2 803 GW by 2050. North America would still have the second-largest installed capacity, reaching 1 728 GW by 2050, with the United States still dominating the region.
Europe could still hold the third place among regions in 2050, with 891 GW of total solar PV capacity installed. More than 22% of these installations would be in Germany, where the installed capacity is projected to reach around 200 GW by 2050. Even though installed capacity may remain highest in Asia, North America and Europe, market growth seems likely to shift to other regions, with large markets also expected to emerge in South America and Africa.
South Australia achieved one of the world’s highest levels of solar penetration in 2020. The state’s power system has become the world’s first large-scale system to approach the point at which rooftop solar PV effectively eliminates the demand for electricity from the grid.
Achieving the decarbonization scenarios requires significant acceleration of clean energy deployment. Compared with the approximately 15 GW of solar capacity deployed in 2020, annual solar deployment doubles in the early 2020s and quadruples by the end of the decade in the Decarb+E scenario. Similarly, substantial solar deployment rates continue in the 2030s and beyond. Deployment rates accelerate for wind and energy storage as well.
Continued technological progress in solar—as well as wind, energy storage, and other technologies—is critical to achieving cost-effective grid decarbonization and greater economy-wide decarbonization. Research and development (R&D) can play an important role in keeping these technologies on current or accelerated cost-reduction trajectories. For example, a 60% reduction in PV energy costs by 2030 could be achieved via improvements in photovoltaic efficiency, lifetime energy yield, and cost. Higher-temperature, higher efficiency concentrating solar power technologies also promise cost and performance improvements.
Further advances are also needed in areas including energy storage, load flexibility, generation flexibility, and inverter-based resource capabilities for grid services. With the requisite improvements, solar technologies may proliferate in novel configurations associated with agriculture, water bodies, buildings, and other parts of the built environment.
Sources:
https://irena.org/-/media/Files/IRENA/Agency/Publication/2019/Nov/IRENA_Future_of_Solar_PV_2019.pdf
https://www.ren21.net/wp-content/uploads/2019/05/GSR2021_Full_Report.pdf
APA. 2012. “Solar Community Engagement Strategies for Planners.” American Planning Association. https://www.planning.org/publications/document/9148284/. Ardani, Kristen, Jeffrey
J. Cook, Ran Fu, and Robert M. Margolis. 2018. “Cost-Reduction Roadmap for Residential Solar Photovoltaics (PV), 2017–2030.” NREL/TP-6A20-70748. https://doi.org/10.2172/1419627.